
Project activities demonstrated that conventional and innovative tools can also be used for identifying and monitoring the consequences of mineral resources exploitation. Environmental assessment studies can be successfully complemented or even upgraded with state of the art and upcoming techniques. Once the different Earth Observation means will be accepted and adopted by relevant legislative instruments and the proper regulations will be in place the widespread use of the demonstrated novel tools and services can be exploited.
Hereinafter you can read in brief about a selection of Remote Sensing tools and services along with exemplary applications.
Technological advancement in the fields of UAVs and sensor have made so much progress in the last 5-10 years, that it is now possible to operate these expensive sensors on reliable UAV platforms. Besides the technological aspects, this technical solution for monitoring environmental phenomena can be a very attractive alternative for a number of practical reasons:
- Cheaper maintenance
- Less complex logistics (not in regulated Airspace)
- Faster deployment (in small truck or car)
- More flexibility (take-off and land at the project)
- More cost-effective (e.g. les mobilization costs)
- Economic for small areas
- Multi-sensor; “plug-and-play” (1 contractor instead of many)
- Less risk to humans
During ImpactMin project the maturity and applicability of Unmanned Aerial Systems were demonstrated. There are best practices and tested applications that are ready to be used in more operational „environments”, not only for research and discover functional disorders. The stability of the platforms is developed and the necessary detection and data processing methods and tools continue to be advancing. ImpactMin case studies can be found below, supported by illustration materials.
ImpactMin project demonstrated not only the technical capabilities of these novel tools, but a significant experience were gathered throughout the Project’s test areas in different countries, were the administrative and official “boundaries” (licensing, permissions etc.) were studied and challenged (Sweden, Bosnia and Herzegovina, Romania).
Videos and pictures with operating the UAS
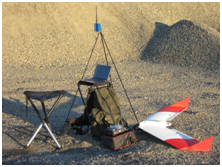
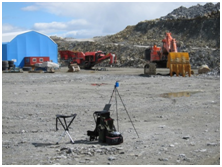
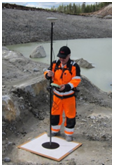
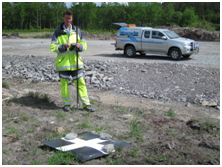
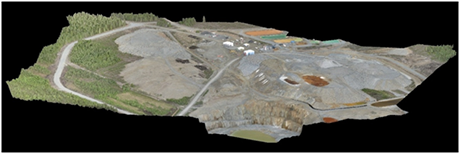
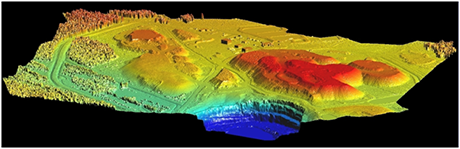
This section provides pictures from operating the SmartOne aircraft as well as a resulting orthomosaic and digital surface model.
|
|
|
|
|
|
|
|
| Figure - SmartOne aircraft and groundstation (a, b), measuring of ground control points (c, d), resulting orthomosaic (e) and digital surface model (f). | |
Videos about operating an UAV
- Mounting of the aircraft and starting a flight mission
- Ground station setup
- SmartPlanes take-off
- SmartPlanes landing
Videos from software handling and showing results
The Rosia Montana airborne hyperspectral survey was flown at an altitude of approximately 750 m above ground, resulting in imagery with approximately 50 cm resolution. 19 lines were flown with a total line length of approximately 140 km.
The airborne hyperspectral survey was realized by an excellent collaboration of a team that consisted of:
- Hansa Luftbild GmbH (Germany)
- Specim Oy in association with University of Helsinki (Finnland)
- Geosense B.V. (the Netherland)
- VITO (Belgium)
- Geonardo Ltd. (Hungary)
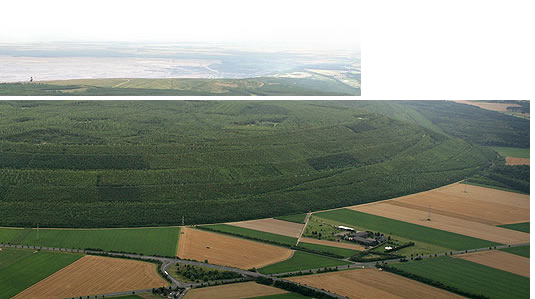
In order to keep the survey as innovative as possible, it was decided to fly at a very low altitude (<750m AGL), which is a major challenge in such mountainous terrain like Rosia Montana area, and to combine the hyperspectral survey with a SmartPlanes UAV-survey. The acquired data are of very high quality, demonstrating that it is possible to fly a very low altitude hyperspectral survey over a very mountainous area.
On the following illustration materials some of our results can be found with respect to the Rosia Montana research project and the kind of imagery that was recorded (e.g. area extent, spatial resolution, applicability). Further information and the details of the results of the integrated analyses are available via the respective project document (Rosia Montana case study report).
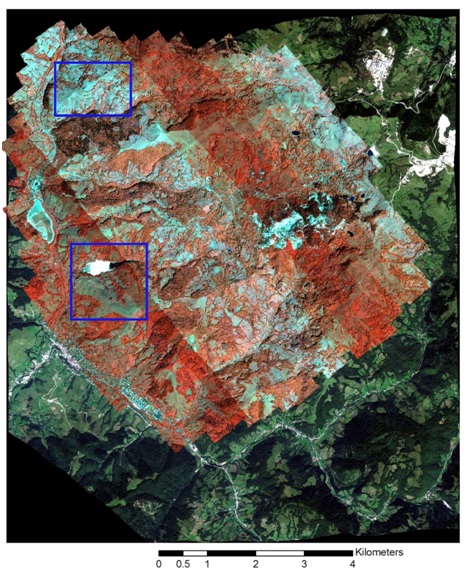 Figure - Hyperspectral strips projected on the WV-2 natural color image, showing the coverage of the hyperspectral survey (red) and of the SmartPlanes survey blocks (blue outlines)
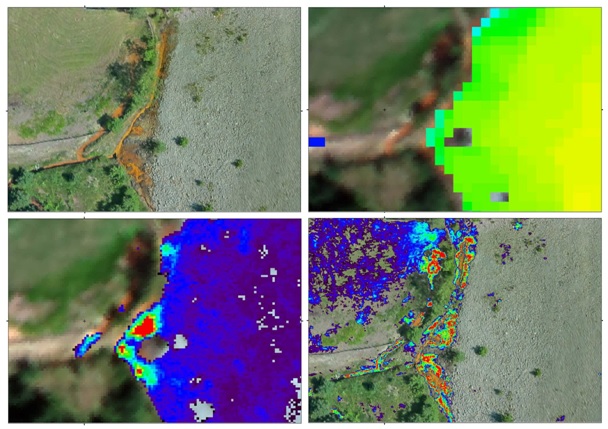 Figure - Comparison of Iron-oxide classification on the basis of WV2 and Hyperspectral imagery for an acid drainage outlet of the tailings dam. A: (top left): Smartplanes image; B: (top right) Classification of WV2-imagery; C: (bottom left) Hyperspectral classification and D: (bottom right) Smartplanes classification
Commercial sensors that are carried on satellite platforms are better in spatial resolution to those that are instrumented mainly for scientific purposes (e.g. Landsat). GeoEye and WorldView 2 are just few of the orbiting systems - provide very high resolution imagery on demand (programmed by the costumer) - that were used for ImpactMin project.
We started our investigation with the analysis of WV-2 imagery, because its high spatial resolution allowed us to examine individual trees and accurately locate the soil samples, while its increased number of spectral bands in the VNIR promised to allow us replicating some of the spectral trends found in the field. We used the leading edge technology of Spectral Evolution PSR-3500 for field investigations. The portable spectrometer allowed us to take in-situ measurements of different tree species. Also, in-situ spectroscopic measurements (solar reflectance) were essential for the calibration of the satellite imagery.
Whilst the field spectroscopy was a fast, non-destructive and very cost-effective method to investigate spectral trends for soil and vegetation at different demo sites, it was very advantageous that we could use satellite imagery to map the variations concerning the above environmental parameters.WV-2 imagery allowed us to cover large and continuous areas, while we were not limited by restrictions such as access. The WV-2 image was calibrated for radiance using the automatic Envi routine. Subsequent atmospheric correction to reflectance was done using the solar spectra of various targets collected in the field in 2012.
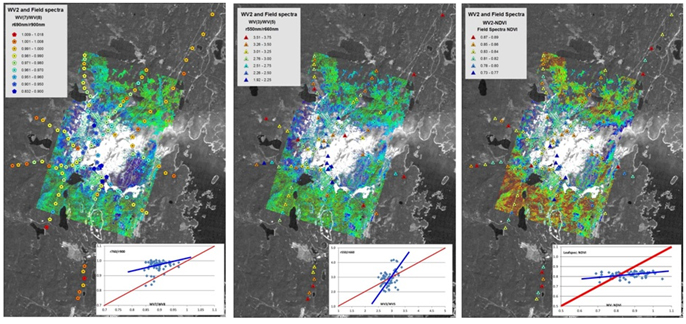
In ImpactMin, we have investigated spectrally measurable variables. Both for in-situ and for the WV-2 imagery, the changes in soil properties as a function of vicinity to the Karabash smelter (Russia) were the increase in iron oxides. We have used the ratio technique so we paid extra attention that everything which is not soil has been masked out. Once we have isolated only the pure soils, the band ratio technique - applied on the imagery - showed a good correlation with the field data (see the illustration below).
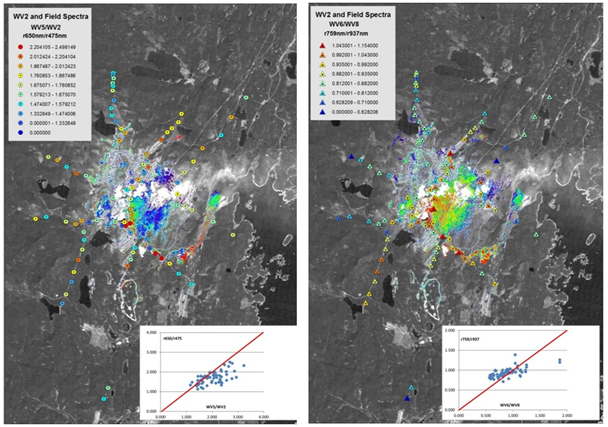
WV5/WV2-image maps mostly goethite, whereas the WV6/WV8 is more generally related to minerals that show a ferric iron absorption feature in the 900nm-wavelength range.
For studying the vegetation, we obviously had to use the bands that corresponded best to the band positions of the field spectra. For the ratio r760nm/r900nm we used WV7/WV8 and for the ratio r550/r660 we used WV3/WV5. For calculation of the NDVI from the field spectra we resampled the field spectra to WV2-spectra using Envi’s spectral resampling module. All three ratio images very clearly reproduce the zoning - of environmental impacts - that was observed in all other data (see the illustration below).